|
One of the main strengths of physics is its use of mathematical modelling. Here are some formulas which may be useful for modelling in the Great Bungee Jump unit.
The relationship between force and motion is central to the model of nature which we call Physics.
{F = force in newtons, m=mass in kg., a=acceleration in meters/second/second}
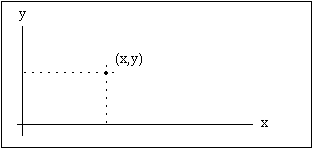
Visualization is often helpful for the study of changing speed. Two
dimensional graphs are used for displaying sets of number pairs which are
related. Usually each of the ordered pairs (x,y) has one number which is
predetermined by the experimenter, and one which is measured. The predetermined
number, called the independent variable, is given a horizontal (x) position
and its related measured number, called the dependent
variable, is given a vertical (y) position.

Figure P1
A Point in XY Space
Graphs of speed vs. time, for example, supplement and clarify the mathematical
model of motion. For these graphs, most everybody is in the habit of using
the horizontal axis for time. Mathematicians and scientists are in the
habit of using the horizontal axis for the independent variable. These
customs are in conflict when time is allowed to be dependent variable.
We choose to plot time on the horizontal axis in keeping with ordinary
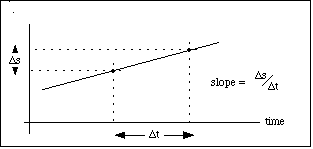
habit, partly because this conveniently makes the slope of a time graph
equal a rate of change. Time graphs are continuous functions which show
how change plays out as time flows forward. The vertical location of a
point on a time graph tells the size at that time, and the slope of a time
graph tells the rate of change.

Figure P2
Slope
On a graph of s vs time, the slope tells the rate at which s
changes with time. If s represents position, then the slope is the
speed.