 Hands On Physics
Haze
Concepts
CALIBRATION DATA ANALYSIS
After you find your instrument's ET constant, you will insert it in a formula
that will give you a standardized measurement of haze known as aerosol optical
thickness (AOT).
Graph Paper Method
- Make a table of the TERC VHS-1 measurements for a range of air masses
up to about 10. The first column should be the air mass (m) for each measurement
and the second column the Sun signal - the dark signal.
- Add a third column to your table for the natural logarithm (ln) of
the signal. (Use a scientific calculator with a ln key.)
- Print this title on the abscissa (x or horizontal axis) of the graph:
Air mass (m).
- Print this title on the ordinate (y or vertical axis) of the graph:
ln of signal.
- Label the major divisions of the abscissa 0 to 10, as shown in Fig.
7. <P3>
- Plot the pairs of data in the first and third columns on your table
on the graph.
- Use a straight edge to draw a line through the center of the points.
Extend the line to the ordinate as shown in Fig.
7. <P3>
- The ET constant is where the line crosses the ordinate. Find the value
at this point and write it on your graph as you will need it for the haze
formula. The ET value derived from the hand drawn graph in Fig.
7 <P3> is based on the first Langley test made with a prototype
TERC VHS-1. The ET constant is 1.292, which is very close to the values
given by the calculator and a computer program.
Scientific Calculator Method
- Make a table of the TERC VHS-1 measurements for a range of air masses
up to about 10. The first column should be the air mass (m) for each measurement
and the second column the Sun signal - the dark signal.
- Add a third column to your table for the natural logarithm (ln) of
the signal. (Use a scientific calculator with a ln key.)
- Enter the data pairs into a scientific calculator capable of performing
a linear regression.
- Insert the coefficients given by the calculator to calculate the ln
of the signal when m = 0. This number is the ET constant, so write it on
your table. The ET constant for the prototype TERC VHS-1 is 1.2946.
Computer Spreadsheet Method
- The TERC VHS-1 spreadsheet program (5)
automatically determines the air mass for each data point. You can then
use a scientific calculator, the spreadsheet's regression function or curve-fitting
software to find the formula for the best fit through the points. The TERC
VHS-1 spreadsheet can be downloaded from: ftp://ftp.concord.org/pub/haze/vhs1-download/
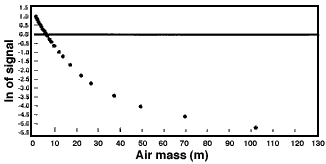
- Figure P4 below shows a computer-generated graph of the all the data
from the first Langley test of a TERC VHS-1. Notice how the data begin to
curve when the air mass exceeds about 10? This established that the upper
air mass limit for this instrument is m = 10.

Figure P4
Langley Plot
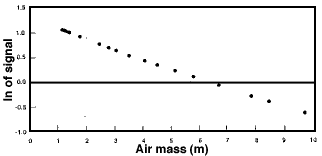
The next figure shows a second computer-generated graph for only the data
up to m = 10. Notice how the points appear to form a straight line.

Figure P5
A Part of the Langley Plot
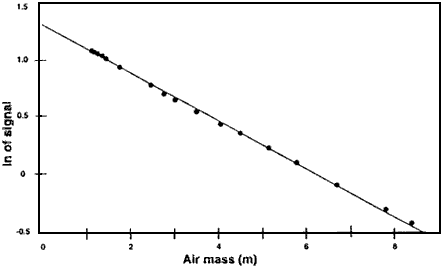
- The graph below shows that the points in Figure P5 form a very straight
line indeed. This graph was made with a powerful curve-fitting program called
TableCurve (Jandel Scientific). In only seconds, this program fitted the
data to hundreds of mathematical functions. It then drew the graph below
in Fig. P6 for the straight line formula (y = a + bx).

Figure P6
Fitting the Curve
The program also gave the coefficients for the formula and the value of
the Sun signal for m = 0 (the ET constant). The ET constant for the prototype
TERC VHS-1 is 1.2946, the same number provided a little more slowly by a
standard scientific calculator using the same data.
Previous
Page || Up a Level || Index
|| Next Page


