Hands-On-Physics | |
Heat & Temperature
|

Is there an alternative to looking up values on a graph? Is there a mathematical
way of finding the best fit? The answer is yes, providing you know the equation
of the curve. For instance, physics predicts that the resistance of a thermistor
should obey the equation: R = Roe a/(T+To) Here, Ro and a are the calibration
constants like a and b in the straight-line fit. To is the ice temperature
in the Kelvin scale, 273.2 °K. Once again, you don't have to understand
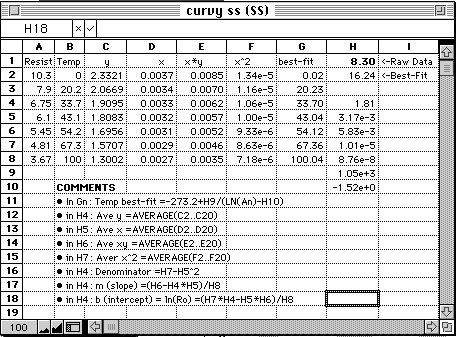
the mathematics to use this equation. Here is a ClarisWorks spreadsheet
you can use with thermistor data. Just copy it into a ClarisWorks spreadsheet
and use it. Enter your calibration data into cells A2...B8. Enter a resistance
reading in k in H1 and read the best fit temperature in °C in cell
H2. The other cells in column H are used to calculate parts of the best-fit
equation. The best-fit for temperatures for plotting the calibration curve
are calculated in cells G2...G8.

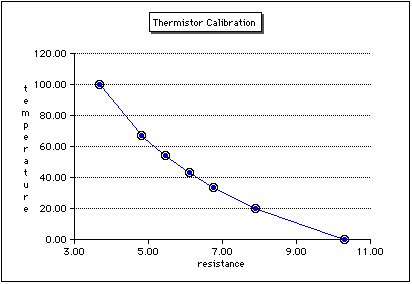
The graph in figure C? shows the best-fit calculations lining up with
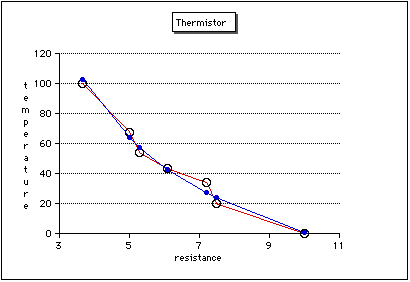
the experimental measurements. Suppose the resistance measurements were
not as carefully recorded and looked like this: 10, 7.5, 7.2, 6.1, 5.3,
5, and 3.67 K ohms. Then the calibration curve calculations would then be
quite different than the experimental data.
