 |
Hands-On-Physics
MECHANICS
|
Extensions
|
- Speed & Energy -
|
The work done on the Aircart by the propeller force increases the Aircart's
energy by making it speed up. How is the speed of the Aircart related to
its energy? The Aircart gets its energy from the work done on it by the
propeller. This work is simply the product of the force and distance it
moves. If you assume that the propeller force is constant, then the energy
of the Aircart will be proportional to its position (distance from start).
You can study the relationship between energy and speed by examining the
two variables, position and speed. To study the changing speed of the Aircart,
several sequential speed measurements must be made. You can use a lap-timer
stopwatch to time the Aircart as it moves along the floor, or if Microcomputer-Based-Laboratory
(MBL) apparatus is available, you can use that to study the Aircart moving
a shorter distance on top of a lab bench.
Energy & Speed
The work done on the Aircart by the propeller force increases the Aircart's
energy by making it speed up. How is the speed of the Aircart related to
its energy? The Aircart gets its energy from the work done on it by the
propeller. This work is simply the product of the force and distance it
moves. If you assume that the propeller force is constant, then the energy
of the Aircart will be proportional to its position (distance from start).
You can study the relationship between energy and speed by examining the
two variables, position and speed. To study the changing speed of the Aircart,
several sequential speed measurements must be made. You can use
a lap-timer stopwatch to time the Aircart as it moves along the floor,
or if Microcomputer-Based-Laboratory apparatus is available, you can use
MBL to study the Aircart moving a shorter distance on top of a lab bench.
You can produce a mathematical model relating energy and speed. What is
this equation?
Measuring Changing Speed with a Stopwatch
If you choose to run the Aircart on the floor, first sweep the floor. Dust
and sand are a problem. In this problem the position is the independent
variable, set up a course for the Aircart by marking regular distance intervals
along the floor about half a meter long (masking tape works well). Physicists
measure distance in meters, unless something more convenient shows up. If
you are working on a tile floor, the tiles are probably 1 foot square. If
so, you might want to use feet and convert to meters later ( 1 foot = 0.3048
meters). Run the Aircart over the course you have set up for it, and measure
the time it takes to travel over each interval. This is similar to the runner
in the Messing Around experiment.
From the distances and the times you can calculate speeds. One problem with
the regular distance intervals is that the Aircart crosses intervals near
the end of the course in very short times, too short to measure accurately.
This problem can be solved by using uneven distance intervals - short in
the beginning and longer near the end. We tried a 15 foot long course, starting
with a 1 ft interval and ending with a 5 ft interval. That approach gave
reasonable timing accuracy.
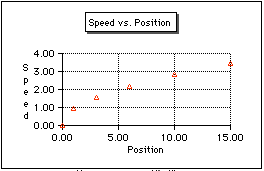
To visualize the relationship between changing speed and propeller work,
a speed vs. position graph is helpful. To make this graph we calculated
the speeds at the end of each distance interval. The speed at the end
of the interval is the average speed in the interval plus a little extra
because the Aircart is speeding up (average speed + acceleration * half
the time interval). The acceleration was gotten from a speed vs. time graph.
We used a spreadsheet, but the calculations and graphing can be done by
hand.

Figure E5
Speed vs. position graph
After you have set up the course for running the Aircart, make a table
for listing the distances and recording the times for several runs. Run
the Aircart through the course a few times and get several sets of measurements.
Calculate the average time for each distance interval, and then the average
speed in each interval. Now calculate the speed at the end of each interval
(average speed + acceleration * half the time interval). The acceleration
can be gotten from a speed vs. time graph.
Graph speed vs. position. Careful experimentation will produce a graph which
is not linear (not a straight line). Non-linear graphs are a problem. Straight
line graphs are nice because they lead to simple mathematical models based
on the equation for a straight line (y=mx+b). Your data can be turned into
a straight line graph by squaring one of the variables and re plotting. From
this graph you can produce a mathematical model relating energy and speed.
What is this equation? The slope of your linear graph is a constant composed
of two physical quantities which remain constant in this investigation;
the propeller force and the Aircart mass. What is the value of this constant
(calculated from mass and force)? Teacher
Note: Speed & Position
Measuring Changing Speed with MBL
If you have Microcomputer Bases Laboratory capability, you can get velocity
information about the Aircart using photogates or a "smart pulley".
We had the Aircart pull a thread attached to a hanging paper clip over a
"smart pulley". The Aircart moved about half a meter along a table
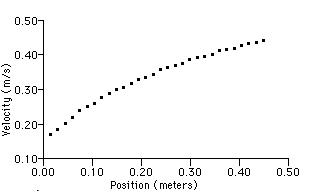
top. With our smart pulley attached to a Vernier Universal Lab Interface
(ULI), we got a speed (velocity) vs. position graph.

Figure E6
MBL speed vs. position graph
The MBL data can be transferred to a spread sheet and then analyzed using
the calculating and graphing power of the spread sheet.
Previous Page ||
Up a Level ||
Index ||
Next Page