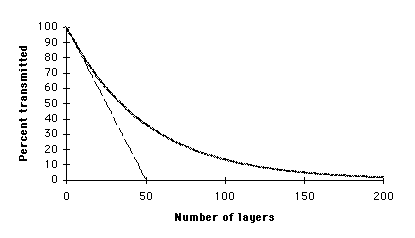
The figure above shows three curves, two of which are indistinguisable.
The straight line represents subtracting 2% of the original light each layer.
One curved line represents subtracting 2% at each layer of the light reaching
that layer. The other curved line, which follows almost exactly the same
curve, is a graph of the function

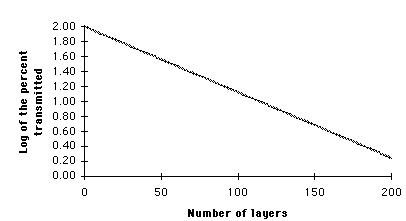
This is the log to the base 10 of the percent reaching each layer, representing
a graph of the log of the curved line above.

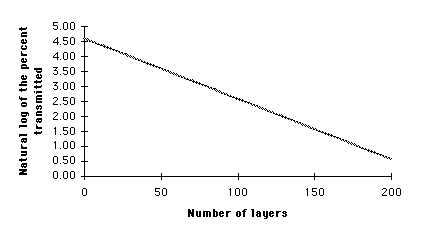
This is the natural log (log to the base e) of the percent reaching each
layer. It is also the graph of the equation g(n) = ln(f(n)) = ln(100)-.02*n
= 4.605 - .02*n