|
 Hands On Physics Hands On Physics
Haze
Messing Around
SOLAR SPECTRUM
|
Overview Light consists of different
colors that can be separated out into a spectrum
Materials For this activity you will
need a collection of colored paper and filters
Tools You will need a slide projector
or overhead projector
Questions What is color?
Activities Project a spectrum and investigate
the effects of colored light.
Overview
Light consists of different colors that can be separated out into a spectrum.
In this activity, you will create a spectrum and find out how different
materials and detectors respond to the different colors. The colors you
see in a rainbow run from red to blue and form the visible part of the spectrum.
There is also light you cannot see beyond both ends of this spectrum, infared
(IR) beyond the red end, and ultravilot (UV) beyond the blue.
All these colors can be mixed together to make white light. Furthermore,
colors hidden in white light can be separated. In this activity you will
separate the white light from a slide projector into its rainbow colors
to make a specrum. You then can use this spectrum as a source of pure colors
for experiments. You can try out the effect of colored paper and filters
on these. You can also use the spectrum to better determine what colors
each detector responds to.
Materials
For this experiment, you need:
- a collection of colored paper and filters. If possible, find paper
and filters with a selection of bright, saturated colors. Locate some fluorscent
paper or cloth: white cloth often fluoresces because soaps include fluorscent
compounds that make the wash appear "whiter than white".
- the photodiode and green LED used before
- the opamp amplifier circuit for the diode detectors.
- a slide frame (you could push the film out of an old slide)
- aluminum foil
- a diffraction grating,
- tape
Tools
You will need to borrow a slide projector or an overhead projector. This
exploration requires a powerful white light souce, and a slide projector
is probably the easiest to use.
Questions to think about:
- What is the effect of filters on different colors?
- What happens when colored light falls on paper of different colors?
- What colors are the two detectors sensitive to?
Activities
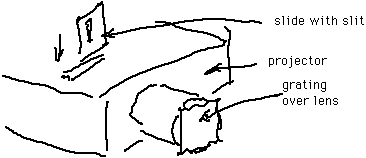
Make up a slide that is a slit by covering the slide with aluminum foil.
Leave a vertical slit uncovered in the center about 1 mm wide.

Figure M10
Spectrum Projector
Place the slit you made in the slide projector where slides normally
go. Aim the projector to the left edge of a white wall or surface. Adjust
the focus so you see a clear image of the slit. Place the grating over the
lens of the projector. Now, when you turn on the projector, you should get
a beautiful spectrum to one side. Rotate the grating until the brightest
spectrum is to the right of the slit image. Tape the grating in place.
An overhead projector will also work for making a spectrum.
Cover the top with a large piece of light proof paper or cardboard with a slit cut in
it. Try a slit about a quarter inch wide and several inches high. Put diffraction
grating over the front of the lens.
Project the spectrum on a white surface in a dark room.
This technique for viewing white light spectra was first published in The Physics Teacher:
Philip M. Sadler. Projecting Spectra for Classroom Investigations. The Physics Teacher, 29(7), 1991, pp.
423-427.
- Look at it through various filters. Record what you see and relate
it to the color of the filters.
- Allow the spectrum to fall on different colored paper and the flourscent
paper. Record what you see and how it relates to the color of the papers.
- Select a detector and measure its response at different parts of the
spectrum, including IR and UV. Where does it have the most response? The
least? Repeat for each detector. How is the color of the LEDs related to
the color of their greatest response?
Reporting
Keep a journal as scientists do, even when messing around. Record all your
questions and observations in a bound notebook. Don't erase, just cross
out errors. Write enough so someone else could reproduce your experiments.
Diagrams can save lots of words and help make your ideas clear. If you make
measurements, record your data, with units. Tables are useful for repeated
similar measurements. To make the logic of any calcuations clear, first
record the formula you used, then show the numbers used to evaluate the
formula, and finally your answer.
Previous Page || Up
a Level || Index || Next
Page
