 Hands On Physics
The Great Bungee Jump
Core Project
Step 5: Applying Mathematics
Overview
This page shows how to use a mathematical model of the bungee jump and to
compare your data with the model.The mathematical model is a computer spreadsheet that can calculate the position and motion of a bungee jumper at different times during the jump. To model your setup, you must supply certain information specific to your jump. If the model seems to work for your tower, perhaps you can apply it to jumping out a building.
You don't need to understand the mathematics of the model to use it. But if you are interested, go to the explanation in the Concepts section.
The Story, Continued
Our intrepid Hands-On-Physics students were trying to determine whether a bungee cord could be used as an escape device to get out of a high rise building in an emergency. A small scale model is great for investigating what happens to a weight attached to a bungee cord, but cannot directly tell what will happen to a full sized bungee jumper. Nobody wanted to volunteer to jump out of a high rise tower to test the bungee jump escape device, so our students needed a mathematical way to predict what would happen during the jump. In this investigation you will compare your data to results predicted by a mathmatical model of the jump and use the model to predict what might really happen.
Experimenting With the Model
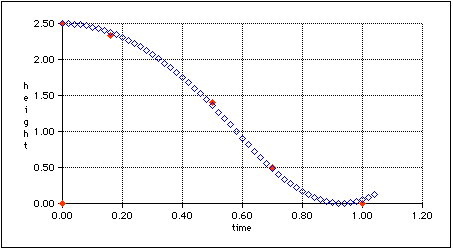
1. Look at the spreadsheet model. Open the model called "Bungee Model." You need ClarisWorks 4 or later to run this model. The output of the spreadsheet model is a graph that looks like the following:
Spreadsheet Graph
This ia graph of the height of the bungee jumper as a function of time.
The solid red diamonds represent your data. The open blue diamonds are the
heights predicted by the mathematical model. This particular graph shows
reasonably good agreement between the data and the model.
The input to the mathematical model is the set of cells in the upper
left of the spreadsheet that look approximately like the following:
Parameters time height
Height of mass at start 2.50 m 0 2.50
Height of mass when bungee cuts in 1.25 m 0.16 2.33
Height of mass at rest 0.83 m 0.51 1.34
Size of mass 0.5 kg 1.01 0.01
Time step size 0.02 sec 0.72 0.44
Air friction 0.1 kg/m
The numbers shown above are from an experiment students ran in a test
of this unit.
2. Adapt the model to your experiment. Wherever there is a bold number
in the spreadsheet, you need to enter your own data. The graph and
all the other cells are computed from the bold numbers you enter.
First, add the first four of the parameters you have
measured:
- Height of mass at start.
- Height of mass when bungee cuts in
- Height of mass at rest
- Size of mass
3. Put in your data. Add your values for the height at various times starting in cell D4 and D5 and going down. This example shows four pairs, but you should have more and thees can just extend down as far as you like. As soon as you enter a pair, you should see that shown as a red point on the graph.
Note that one point is automatically added at the top of the table. This corresponds to the hieght of the jumperr when the timer starts. Do you see where this comes from?
4. Look at the results. Compare the results calculated by the model to your results. Examine the effect of changing the time step size. See what the effect is of adding air friction to the model by entering different values like 0.1 and 1. Vary the parameters to get the best match between the model and data.
Answer the following questions:
- Are the calculated results and your data similar?
- Did the mathematical model predict that the lead metal weight would stop short of hitting the floor? (Check the minimum height)
- How do the times and heights computed by the model compare to your measurements?
- Out of all of the parameters, which one do you know the least about?
- How can you "fine tune" your mathematical model to make it better represent your data?
Remember, you want the jumper to be slowed to a stop just at, or just above the sidewalk, so look at the mimimum height. You also want the jumper to be lowered as gently as possible. Look at the maximum force exerted by the bungee cord. Compare this force (measured in newtons) to the force exerted by gravity (the weight of the jumper in newtons). How many times his own weight will he be subjected to? Can you make this force smaller?
Using the model, answer the following questions:
- Would the largest force be uncomfortable?
- What is the effect of changes in air friction?
- What might cause differences in air friction between one jumper and another?
- Would a 10% error in any parameter have a bad effect on a jumper? What about 2%?